
Overview of VINCI Scope 3 in 2019 (baseline year)
In 2019, VINCI’s indirect emissions (Scope 3) totalled approximately 41 million tonnes of CO₂ equivalent, a level maintained in 2021. One-third of these emissions are produced by upstream operations and two-thirds by downstream operations. Two categories account for nearly 90% of emissions: purchases and the use of built, operated and maintained infrastructure.
About 83% of upstream emissions, totalling around 16 million tonnes of CO₂ equivalent, come from purchases, primarily construction materials (concrete, steel, bitumen, etc.).
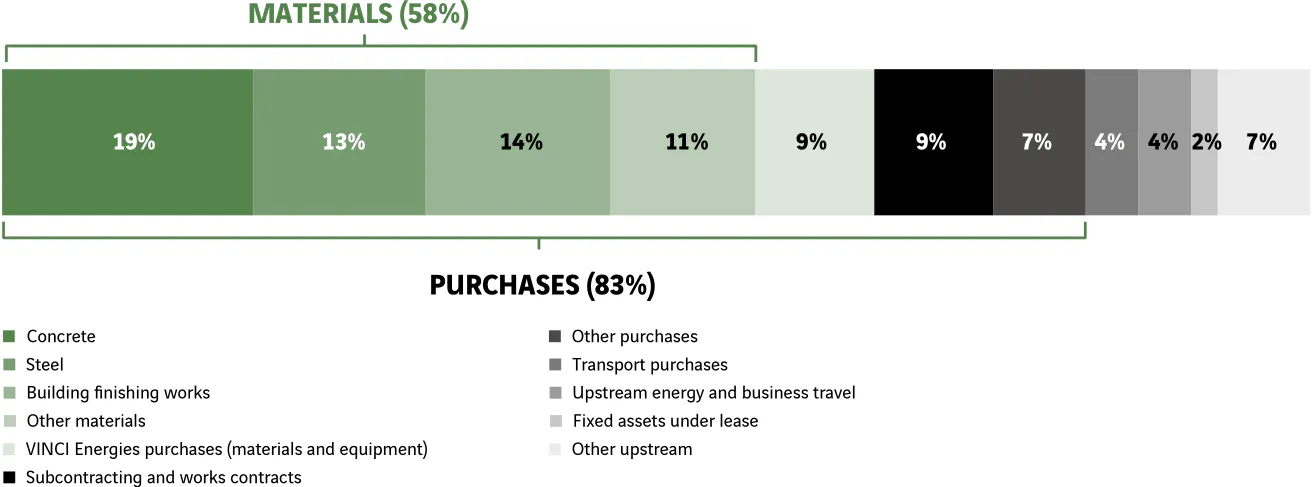
This diagram shows in percentage VINCI’s indirect emissions (Scope 3) and concerned categories.
MATERIALS (58%)
- 19% Concrete
- 13% Steel
- 14% Building nishing works
- 11% Other materials
- 9% VINCI Energies purchases (materials and equipment)
- 9% Subcontracting and works contracts
- 7% Other purchases
- 4% Transport purchases
- 4% Upstream energy and business travel
- 2% Fixed assets under lease
- 7% Other upstream
PURCHASES (83 %)
Downstream emissions amount to 25 million tonnes of CO₂ equivalent, of which 16 million tonnes due to traffic on VINCI Autoroutes motorways and 3 million tonnes associated with the landing and take-off (LTO) cycle and passenger access at VINCI Airports as well as road traffic on networks operated by consolidated VINCI Concessions companies. Emissions connected with air and motorway traffic volumes in the Concessions business have been monitored annually for several years and were updated for 2021 (see the table below). As part of the work carried out in 2021 to enhance information reliability, the VINCI Highways business scope taken into account for VINCI Concessions was limited to its consolidated concession businesses. These emissions amount to 0.2 million tonnes of CO₂ equivalent, and were calculated by a specialised consulting firm for the following scope: Lima Expresa (Peru) and Gefyra (Greece).
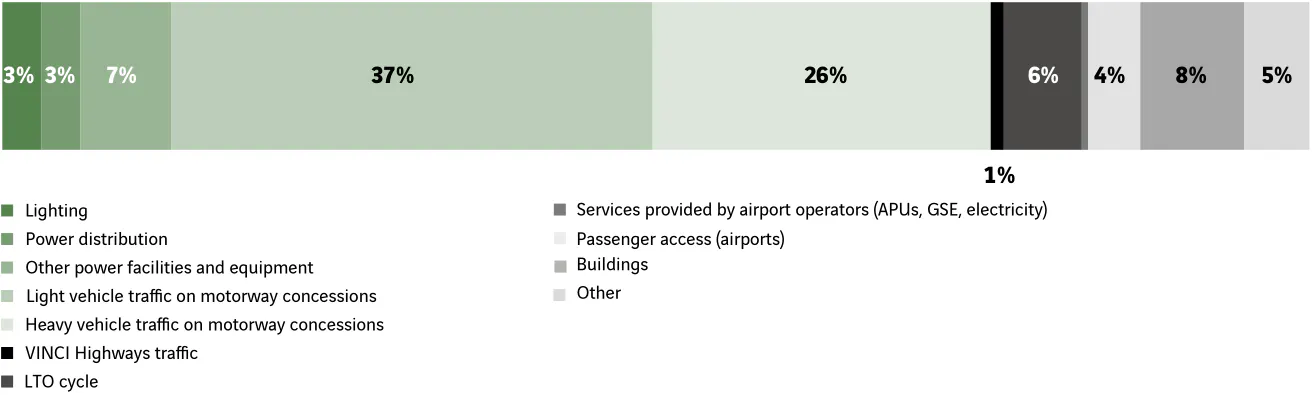
- 3% Lighting
- 3% Power distribution
- 7% Light vehicle trac on motorway concessions
- 37% Other power facilities and equipment
- 26% VINCI Highways trac
- 6% Heavy vehicle trac on motorway concessions
- 4% LTO cycle
- 8% Services provided by airport operators (APUs, GSE, electricity)
- 5% Passenger access (airports)
Scope 3 data monitored in 2021
In 2021, only emissions from motorway and airport operations were updated. This data is presented below and set against direct emissions (Scopes 1 and 2).
CO₂ emissions (Scopes 1, 2 and 3 downstream) of VINCI Concessions companies, customers and end users
| VINCI Autoroutes | VINCI Autoroutes | VINCI Airports | VINCI Airports | |
|---|---|---|---|---|
| (in tonnes of CO₂ equivalent) | 2021(*) | 2020(*) | 2021 | 2020 |
| ISO Scope 1 and 2 emissions | ISO Scope 1 and 2 emissions VINCI Autoroutes 20,951 ☑ |
ISO Scope 1 and 2 emissions VINCI Autoroutes 21,369 ☑ |
ISO Scope 1 and 2 emissions VINCI Airports 91,911 |
ISO Scope 1 and 2 emissions VINCI Airports 99,056 |
| User/third-party emissions (Scope 3 | User/third-party emissions (Scope 3 VINCI Autoroutes 12,980,038 ☑ |
User/third-party emissions (Scope 3 VINCI Autoroutes 11,308,416 ☑ |
User/third-party emissions (Scope 3 VINCI Airports 948,771 (**) |
User/third-party emissions (Scope 3 VINCI Airports 2,588,246 (**) |
(*) Emissions for the environmental reporting period, i.e. from 1 October in year Y–1 to 30 September in year Y for 2020, and from 1 January to 31 December 2021. User emissions uniquely generated by fuel combustion of vehicles on motorways, excluding upstream emissions from fuel combustion.
(**) Year Y−1 emissions taken into account in the Airport Carbon Accreditation (ACA) of year Y. Emissions covering all downstream Scope 3 emissions of the ACA scope required by the GHG Protocol, for the entire consolidated scope.
☑ Data checked to a level of reasonable assurance.